【ggplot】设置坐标轴区域
2019-01-17
 次阅读
次阅读
次阅读
文章目录
问题
|
|
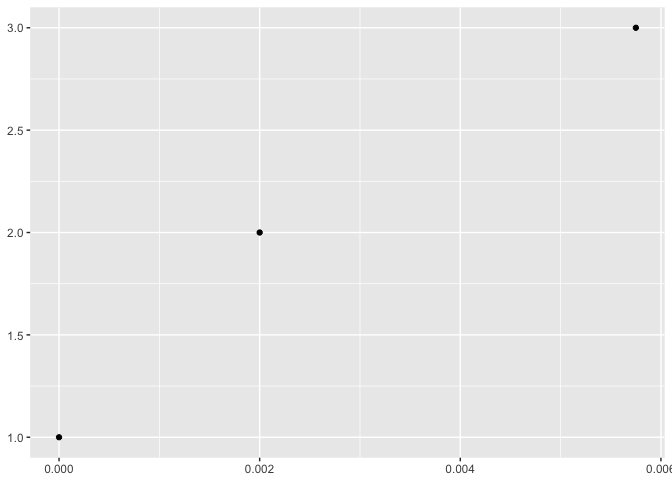
x轴最右端的文本0.006最后一个字符有一半过界了。
解决方案
设定xlim
|
|
设定scale_x_continuous
|
|
在默认设置下,expand对于连续型变量, 会在取值区间的两侧添加5%的范围;对于离散型变量,会在取值区间的两侧添加0.6个单位。
冲突
若同时设置xlim与scale_x_continuous,则后者会覆盖前者的设置。
参考来源
https://guangchuangyu.github.io/cn/2017/04/ggplot2-overflow/