DNA Features Viewer使用

文章目录
最近发表在Bioinformatics的DNA Features Viewer是一个可视化DNA序列特征的Python工具。此为尝鲜。
安装
官方文档目前只提供pip安装方式。issue中有反映要求conda安装方式,评论中有个人提供的linux conda版本,但我没有安装成功。
|
|
使用
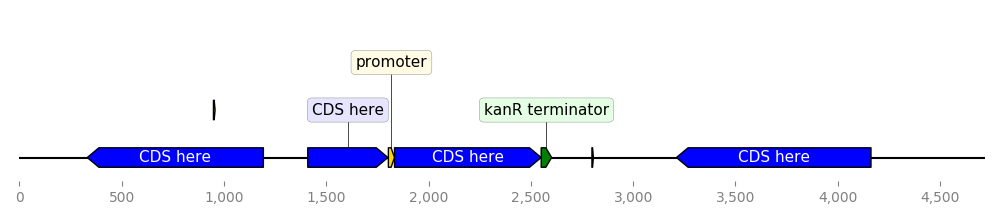
自定义序列特征绘图
|
|
读取genbank数据绘图
dna_features_viewer中含有translate_record函数可读取GenBank格式的数据。但是,将读取到的这些特征解释为绘图内容就可以使用其提供的BiopythonTranslator或自定义MyCustomTranslator.
自定义特征解释器
|
|
Biopython默认特征解释器
|
|
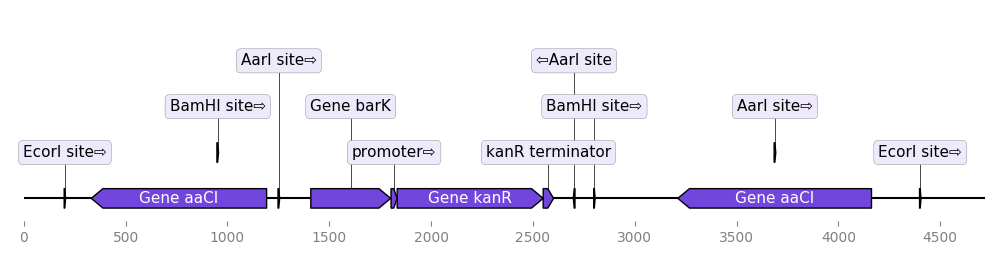
可以绘制圈图,但是所有的注释信息都只能标注在图像上方,而不是像一般的Snapgene之类的工具紧密地随特征标注。
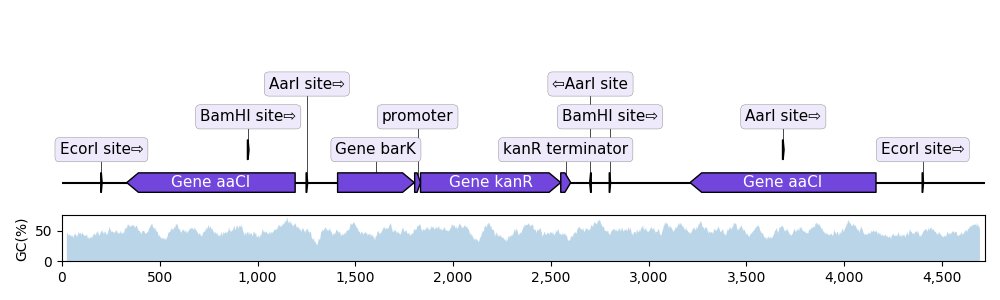
显示GC比例的线性图
|
|
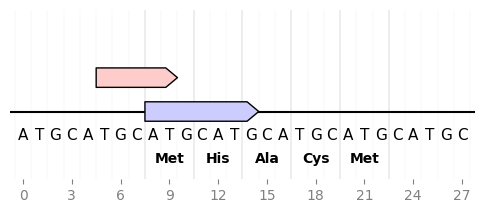
氨基酸编码序列
|
|
GIF
|
|
其他
issues #28中表示希望圈图的注释信息只能位于上方,不能够自定义位置。作者表示可以通过调整CircularGraphicRecord.py实现在上下两个区域标注信息,完整地自定义注释位置目前实现起来还比较困难。
参考来源
https://edinburgh-genome-foundry.github.io/DnaFeaturesViewer/examples.html
https://edinburgh-genome-foundry.github.io/DnaFeaturesViewer/